
ELK Lesson 20:ASP.Net Core整合Elastic APM,並使用Kibana分析效能資訊
Elastic-APM能為我們做什麼
APM全名是Application Performance Monitoring,亦即是”應用程式效能監控”之意,所以我們採用Elastic-APM功能來監控我們的應用程式,監控的方式依據各種環境、開發語言…等因素略有不同,各語言的細節可參考官方的【Elastic-APM支援清單】。
Elastic-APM按不同語言的支援程度,可以監控到HTTP Request、系統例外(Exception)、SQL Query、程式碼執行內容…等,幫助我們快速發現應用程式效能瓶頸與收集程式例外的資訊。
本篇,將以ASP.Net Core為範例打造一個簡單的MVC網頁,並且整合Elasticc-APM,將所有Request效能資料透過APM Server存放至Elasticsearch,再利用Kibana的APM介面觀看結果!
ASP.Net Core MVC網頁整合Elastic-APM Agent
開發環境:
- OS: macOS 11.4 Big Sur
- Frameworks: .Net Core 5.0.302
- IDE: Visual Studio Code 1.58.2
步驟1:創建一個名為ElasticApmSamplle的ASP.Net Core MVC網頁專案,並安裝Elastic.Apm.NetCoreAll插件。
$ dotnet new MVC -o ElasticApmSample使用組合鍵comand + P,叫出Visual Studio Code的Nuget模組,並在對話筐中輸入”> Nuget Package Manager: Add Package”,以此模組協助我們後續安裝插件。

接著輸入我們要安裝的插件關鍵字”Elastic.Apm.NertCoreAll”,按下Enter收尋並等待結果。

稍待一下後,會列出搜尋的結果,因為我們直接搜尋全名,所以只有一個結果,直接點選結果即可。

點選後,稍待幾秒鐘會列出所有可用的版本,我們就直接選用最新的版本即可,若對個版本與伺服器的對應有疑慮,請在【官方網站的Agent and Server compatibility頁面】確認!

稍待系統安裝插件後,右下角會顯示成功的通知。

然後會顯示需要重新載入專案的通知,此時請按下”Restore”或重啟Visual Studio Code即可。

步驟2:設定APM插件。
開啟Startup.cs檔案,新增參考,並於Configure區段注入Agnet,程式碼如下:
using Elastic.Apm.NetCoreAll;

namespace ElasticApmSample
{
    public class Startup
    {
        // This method gets called by the runtime. Use this method to configure the HTTP request pipeline.
        public void Configure(IApplicationBuilder app, IWebHostEnvironment env)
        {
            app.UseAllElasticApm(Configuration);
            //...
        }
    }
}
在appsettings.json新增設定,如下ElasticApm區段。
{
  "Logging": {
    "LogLevel": {
      "Default": "Information",
      "Microsoft": "Warning",
      "Microsoft.Hosting.Lifetime": "Information"
    }
  },
  "AllowedHosts": "*",
  "ElasticApm": {
    "ServiceName": "ElasticApmSample",
    "ServiceVersion": "v1.0",
    "Environment": "Production",
    "LogLevel": "Debug",
    "ServerUrl": "http://IP or Domain Name:8200",
    "TransactionSampleRate": 1.0
  }
}
各設定參數說明如下:
| # | 參數名稱 | 用途 |
| 1 | ServiceName | 指定服務名稱 |
| 2 | ServiceVersion | 指定版本號 |
| 3 | Environment | 指定環境 |
| 4 | LogLevel | 指定要被紀錄的層級 |
| 5 | ServerUrl | 指定APM Server |
| 6 | TransactionSampleRate | 採樣比率,從0.0~1.0,亦即0%~100% |
所有參數及用途請參考官方的【參數說明】網頁。
到此,我們已經安裝、設定Elastic APM插件,執行專案,把網頁跑起來(如下圖),並且隨意點選連結,稍後我們就可以在Kibana上看到APM所監控的資料。

在Kibana上分析效能資訊
若上述設定都沒問題,程式也跑起來了,那我們就可以進到Kibana的畫面,找到APM的頁籤,裏面就有Kibana預設的效能分析功能,以下就幾個主要的畫面做說明。
Services

- 參考上述設定檔中所設定的環境參數Environment,可以指定環境。
- 當應用程式在不同的主機執行,以此可以指定只顯示哪一台主機所收集的APM資訊。
- 這裡可以指定Agnet,基本上就是可以指定哪些開發語言,
- 所有上述設定的條件所對應的結果,可以點擊Name看更詳細的資訊。
Traces

該功能可以看到指定時間、條件的APM資料,並且是按照不同程式、網頁、API…等分類。
Service Map
若我們需要將不同系統/應用程式之間的關聯視覺化,此功能就可以輕易的幫助我們,但要購買授權!因為我也沒有授權,所以就不Demo!
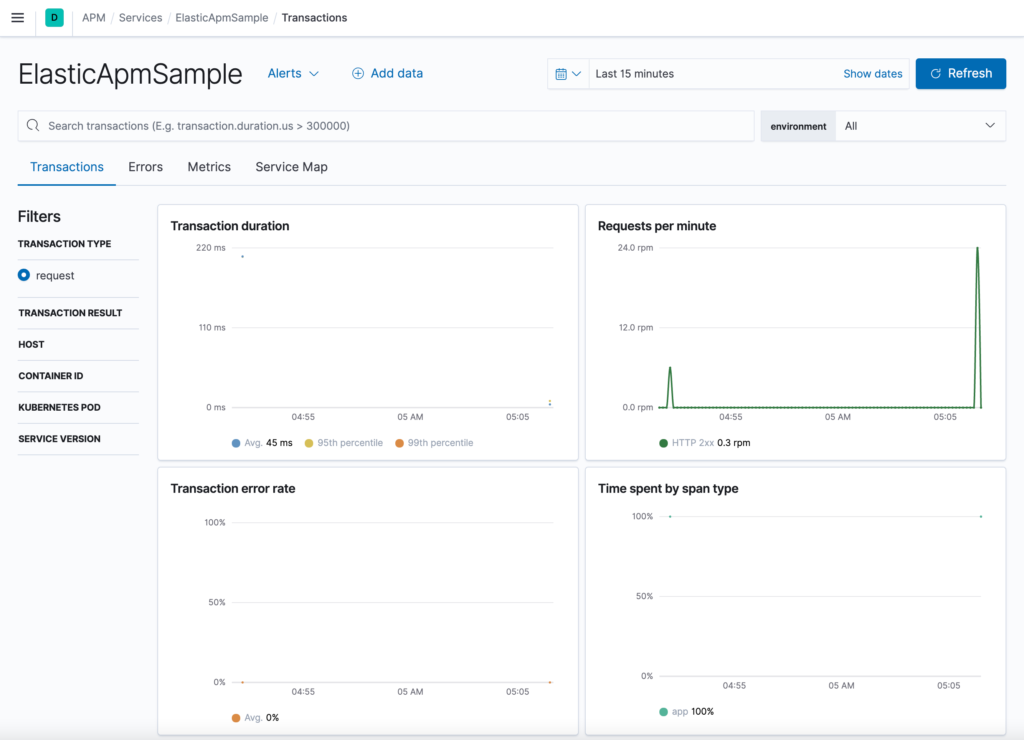
專案效能資訊
單一Request效能資訊

Request的內容

~ END ~