
ELK Lesson 23:使用Heartbeat監控Server、Web與Socket
監控方式
Heartbeat提供的監控方式有三種,分別為ICMP、HTTP、Socket,其又對應主機、網頁/Restful API與網路服務。接下來,分別說明如何設定監控,並在最後展示Kibana上的畫面。
以ICMP模組監控主機
ICMP通訊協定就是所謂的Ping,Heartbeat使用Ping的方式確認目標主機是否會正常回應,若收不到回應,則表示主機不正常。
在/etc/heartbeat/monitors.d資料夾中新增一個設定檔host.yml。
# These files contain a list of monitor configurations identical
# to the heartbeat.monitors section in heartbeat.yml
# The .example extension on this file must be removed for it to
# be loaded.

- type: icmp # monitor type `icmp` (requires root) uses ICMP Echo Request to ping
  # ID used to uniquely identify this monitor in elasticsearch even if the config changes
  id: my-icmp-monitor

  # Human readable display name for this service in Uptime UI and elsewhere
  name: My ICMP Monitor

  # Name of corresponding APM service, if Elastic APM is in use for the monitored service.
  #service_name: my-apm-service-name

  # Enable/Disable monitor
  enabled: true

  # Configure task schedule using cron-like syntax
  schedule: '@every 10s' # every 5 seconds from start of beat
  #設定每10秒ping一次目標主機

  # List of hosts to ping
  hosts: ["lab-elk-2.example.com"]
  #指定監控的目標主機

  # Configure IP protocol types to ping on if hostnames are configured.
  # Ping all resolvable IPs if `mode` is `all`, or only one IP if `mode` is `any`.
  ipv4: true
  #ipv6: true
  mode: any

  # Total running time per ping test.
  timeout: 16s

  # Waiting duration until another ICMP Echo Request is emitted.
wait: 1s更詳細的設定參數請參考【官方網站】。
以HTTP模組監控網頁
藉由Heartbeat的HTTP模組模擬人類瀏覽Web的方式,並且將預期的結果設定好,Heartbeat就會自動呼叫Web,並藉由判斷Response來確定Web是不是正常運作。
在/etc/heartbeat/monitors.d資料夾中新增一個設定檔web.yml。
# These files contain a list of monitor configurations identical
# to the heartbeat.monitors section in heartbeat.yml
# The .example extension on this file must be removed for it to
# be loaded.

- type: http # monitor type `http`. Connect via HTTP an optionally verify response
  # ID used to uniquely identify this monitor in elasticsearch even if the config changes
  id: my-http-monitor

  # Human readable display name for this service in Uptime UI and elsewhere
  name: My HTTP Monitor

  # Enable/Disable monitor
  enabled: true

  # Configure task schedule
  schedule: '@every 30s' # every 5 seconds from start of beat
  #可以指定heartbeat多久來確認一次服務

  # Configure URLs to ping
  hosts: ["http://192.168.50.101:5601/login?next=%2F"]
  #要被監控的網址

  # Configure IP protocol types to ping on if hostnames are configured.
  # Ping all resolvable IPs if `mode` is `all`, or only one IP if `mode` is `any`.
  ipv4: true
  #aipv6: true
  mode: any

  # Expected response settings
  check.response:
    # Expected status code. If not configured or set to 0 any status code not
    # being 404 is accepted.
    status: 200
    #預期應該收到的HTTP狀態碼,若不同,則表示服務故障
以上設定就可以監控一個標準的Web了,若需要驗證、Request Data或其他更進階的操作,可以參考【官方網站】。
基本上監控Web網頁與監控Web Service、Restful API是一樣的方式,只是在Request Body或Request method不同而已。
以Socket監控網路服務
Heartbeat以Socket的方式去測試TCP或UDP的伺服器是否有正常在接聽,以此判斷服務是否正常運作。
在/etc/heartbeat/monitors.d資料夾中新增一個設定檔tcp.yml。
# These files contain a list of monitor configurations identical
# to the heartbeat.monitors section in heartbeat.yml
# The .example extension on this file must be removed for it to
# be loaded.

- type: tcp # monitor type `tcp`. Connect via TCP and optionally verify endpoint
  # by sending/receiving a custom payload

  # ID used to uniquely identify this monitor in elasticsearch even if the config changes
  id: my-tcp-monitor

  # Human readable display name for this service in Uptime UI and elsewhere
  name: My TCP monitor

  # Name of corresponding APM service, if Elastic APM is in use for the monitored service.
  #service_name: my-apm-service-name

  # Enable/Disable monitor
  enabled: true

  # Configure task schedule
  schedule: '@every 10s' # every 5 seconds from start of beat
  #每10秒確認一次

  #     system defaults will be used (not supported on windows).
  #     If `port` is missing in url, the ports setting is required.
  hosts: ["lab-elk-1.example.com"]
  #指定服務主機

  # Configure IP protocol types to ping on if hostnames are configured.
  # Ping all resolvable IPs if `mode` is `all`, or only one IP if `mode` is `any`.
  ipv4: true
  #ipv6: true
  mode: any

  # List of ports to ping if host does not contain a port number
  ports: [9200]
  #指定服務的Port
更詳細的設定參數請參考【官方網站】。
使用Kibana來觀察服務的UP or Down
Heartbeat的監控資料寫入Elasticsearch後,我們可以從Kibana中的Uptime頁籤觀看視覺化的數據,如下圖:
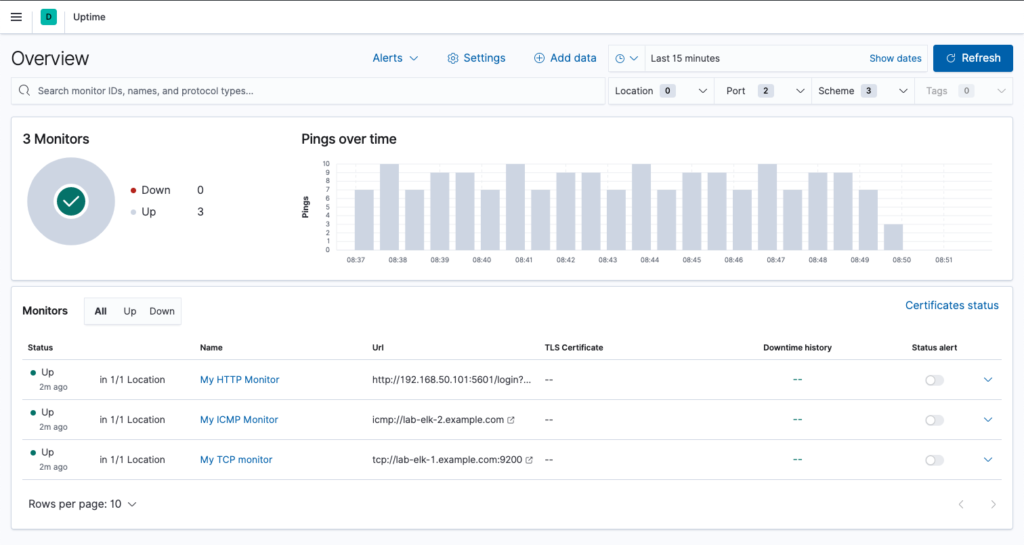
在此畫面,我們可以很輕易的看到有多少被監控的目標,並且判斷他們是否正常運作,很重要的是,HTTP與TCP兩個模組還能另外監控SSL憑證是否到期的資訊,更方便在服務故障時做判斷。
~ END ~