
Elastic Stack 8 EP 5:Metricbeat – 監控基礎架構設施
透過Metricbeat監控基礎架構
Metricbeat是用於收集各式Metrics的工具,從伺服器主機(如:CPU、Memory、Disk…等)到Middleware、AP Server、Web Server、RabbitMQ…等各種工具與軟體,甚至是雲端服務都可以被監控,支援的清單如官方網站。
Metricbeat官方文件:link
設定Metricbeat操作Elasticsearch的帳號密碼
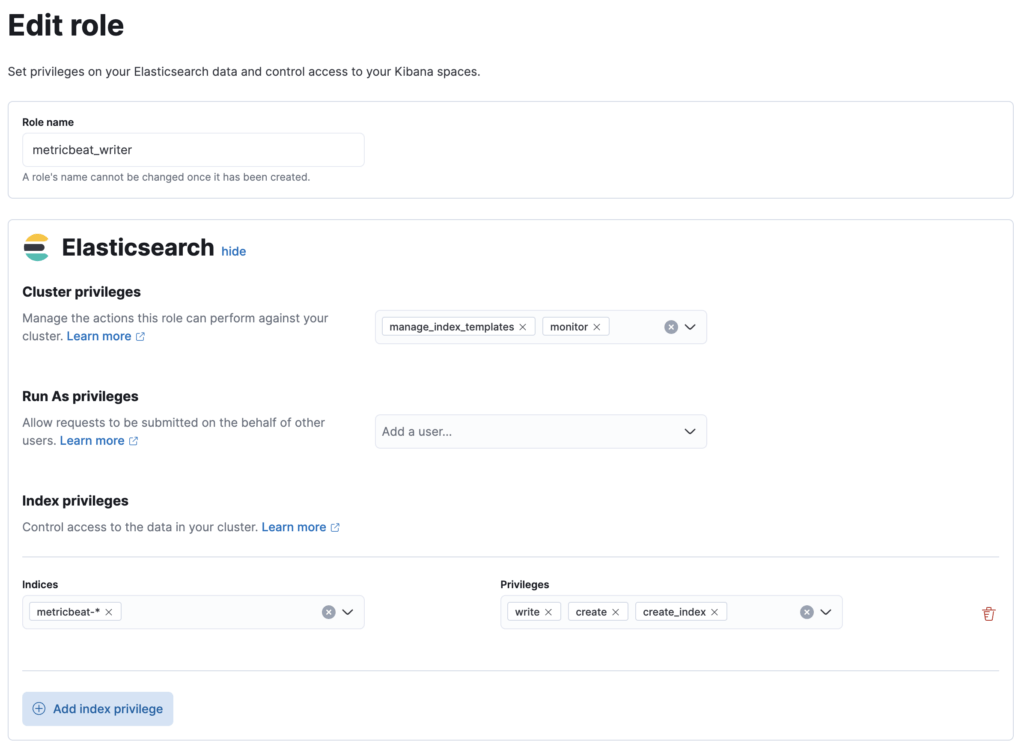
第1步:在Kibana畫面中,左側目錄:Stack Management -> Roles,點選畫面右邊的”Create role”,依照以下畫面新增一個名為”metricbeat_writer“的角色,權限:
- Cluster privileges:manage_index_templates、monitor
- Index privileges:
- Indeces:metricbeat-*
- Privileges:write、create、create_index
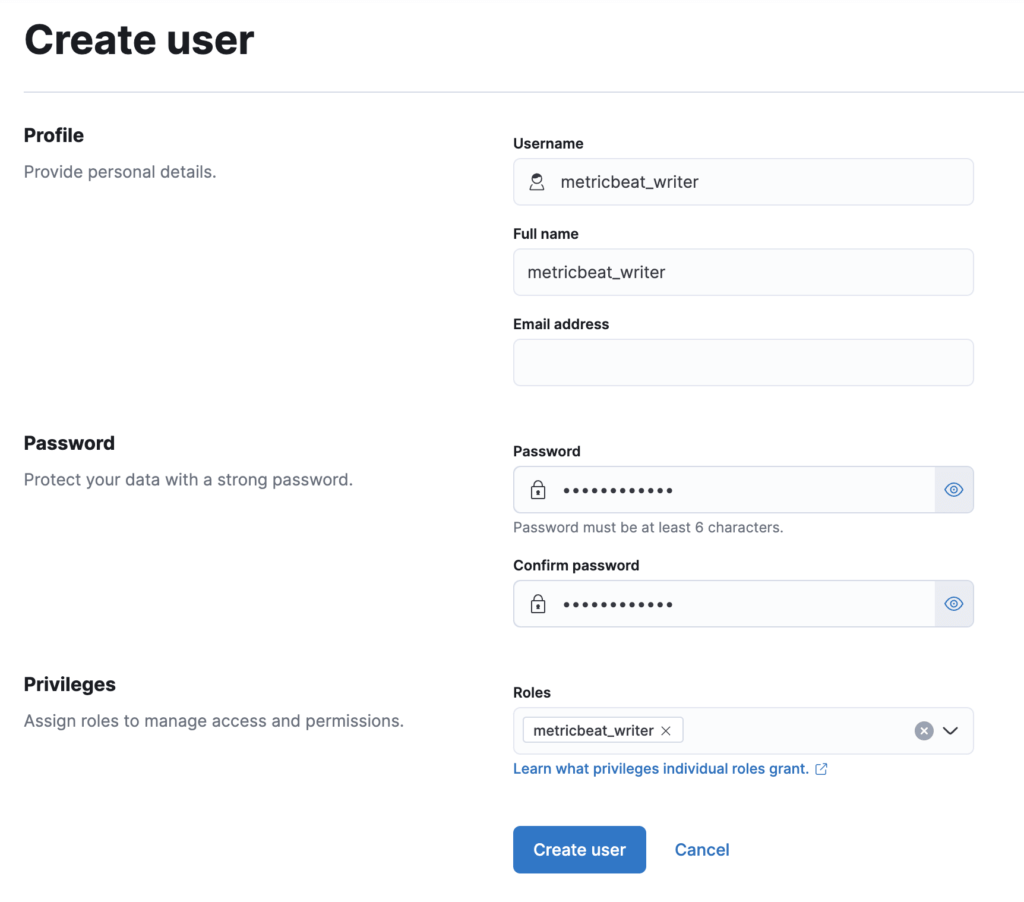
第2步:在Kibana畫面中,左側目錄:Stack Management -> Users,點選畫面右邊的”Create user”,新增一個名為”metricbeat_writer“的使用者,相關設定如下圖:
安裝並設定Metricbeat
第1步:下載Metricbeat的RPM安裝檔至/tmp目錄。
$ cd /tmp/
$ wget https://artifacts.elastic.co/downloads/beats/metricbeat/metricbeat-8.2.2-x86_64.rpm第2步:安裝Metricbeat。
$ yum install metricbeat-8.2.2-x86_64.rpm -y第3步:調整設定檔 (/etc/metricbeat/metricbeat.yml)
$ vi /etc/metricbeat/metricbeat.yml

###################### Metricbeat Configuration Example #######################

# This file is an example configuration file highlighting only the most common
# options. The metricbeat.reference.yml file from the same directory contains all the
# supported options with more comments. You can use it as a reference.
#
# You can find the full configuration reference here:
# https://www.elastic.co/guide/en/beats/metricbeat/index.html

# =========================== Modules configuration ============================

metricbeat.config.modules:
  # Glob pattern for configuration loading
  path: ${path.config}/modules.d/*.yml

  # Set to true to enable config reloading
  reload.enabled: true

  # Period on which files under path should be checked for changes
  #reload.period: 10s

# ======================= Elasticsearch template setting =======================

setup.template.settings:
  index.number_of_shards: 1
  index.codec: best_compression
  #_source.enabled: false


# ================================== General ===================================

# The name of the shipper that publishes the network data. It can be used to group
# all the transactions sent by a single shipper in the web interface.
#name:

# The tags of the shipper are included in their own field with each
# transaction published.
#tags: ["service-X", "web-tier"]

# Optional fields that you can specify to add additional information to the
# output.
#fields:
#  env: staging

# ================================= Dashboards =================================
# These settings control loading the sample dashboards to the Kibana index. Loading
# the dashboards is disabled by default and can be enabled either by setting the
# options here or by using the `setup` command.
setup.dashboards.enabled: true

setup.dashboards.directory: "/usr/share/metricbeat/kibana/"

# The URL from where to download the dashboards archive. By default this URL
# has a value which is computed based on the Beat name and version. For released
# versions, this URL points to the dashboard archive on the artifacts.elastic.co
# website.
#setup.dashboards.url:

# =================================== Kibana ===================================

# Starting with Beats version 6.0.0, the dashboards are loaded via the Kibana API.
# This requires a Kibana endpoint configuration.
setup.kibana:

  # Kibana Host
  # Scheme and port can be left out and will be set to the default (http and 5601)
  # In case you specify and additional path, the scheme is required: http://localhost:5601/path
  # IPv6 addresses should always be defined as: https://[2001:db8::1]:5601
  host: "lab-elk.example.com:5601"

  # Kibana Space ID
  # ID of the Kibana Space into which the dashboards should be loaded. By default,
  # the Default Space will be used.
  #space.id:

# ================================= Processors =================================

# Configure processors to enhance or manipulate events generated by the beat.

processors:
  - add_host_metadata: ~
  - add_cloud_metadata: ~
  - add_docker_metadata: ~
  - add_kubernetes_metadata: ~
不同輸出對象類型的設定如下:
類型1:Output to Elasticsearch
# ---------------------------- Elasticsearch Output ----------------------------
output.elasticsearch:
  # Array of hosts to connect to.
  hosts: ["lab-elk-1.exmaple.com:9200", "lab-elk-2.exmaple.com:9200", "lab-elk-3.exmaple.com:9200"]

  # Protocol - either `http` (default) or `https`.
  protocol: "https"
  ssl.certificate_authorities: ["/etc/metricbeat/http_ca.crt"]

  # Authentication credentials - either API key or username/password.
  #api_key: "id:api_key"
  username: "${es_user}"
  password: "${es_pwd}"
類型2:Output to Logstash
# ------------------------------ Logstash Output -------------------------------
output.logstash:
  # The Logstash hosts
  hosts: ["lab-elk.example.com:5044"]

  # Optional SSL. By default is off.
  # List of root certificates for HTTPS server verifications
  ssl.certificate_authorities: ["/etc/metricbeat/http_ca.crt"]
類型3:Output to Kafka
# ------------------------------ Kafka Output -------------------------------
output.kafka:
  # initial brokers for reading cluster metadata
  hosts: ["kafka1:9092", "kafka2:9092", "kafka3:9092"]

  # message topic selection + partitioning
  topic: '%{[fields.log_topic]}'
  partition.round_robin:
    reachable_only: false

  required_acks: 1
  compression: gzip
  max_message_bytes: 1000000
任何時候都常常會不小心打錯字造成設定檔內容錯誤,可以使用以下指令來檢查設定檔內容喔!
$ /usr/share/metricbeat/bin/metricbeat test config --path.config /etc/metricbeat/

Config OK第4步:建立並設定Keystore。
$ /usr/share/metricbeat/bin/metricbeat keystore create
Created metricbeat keystore

$ /usr/share/metricbeat/bin/metricbeat keystore add es_user
Enter value for es_user: metricbeat_writer
Successfully updated the keystore

$ /usr/share/metricbeat/bin/metricbeat keystore add es_pwd
Enter value for es_pwd: password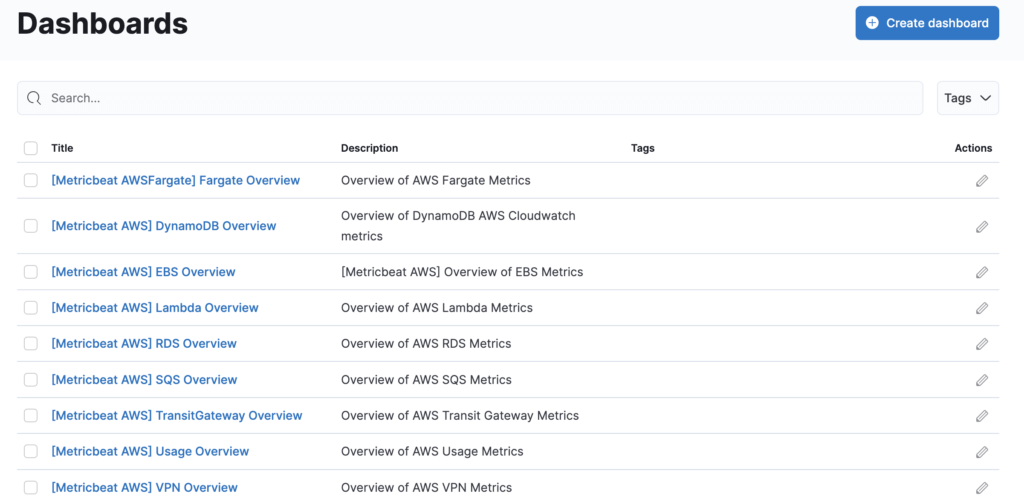
Successfully updated the keystore第5步:使用Metricbeat導入各種預設Dashboard進Kibana。
$ /usr/share/metricbeat/bin/metricbeat setup --dashboards --path.config /etc/metricbeat/
Loading dashboards (Kibana must be running and reachable)
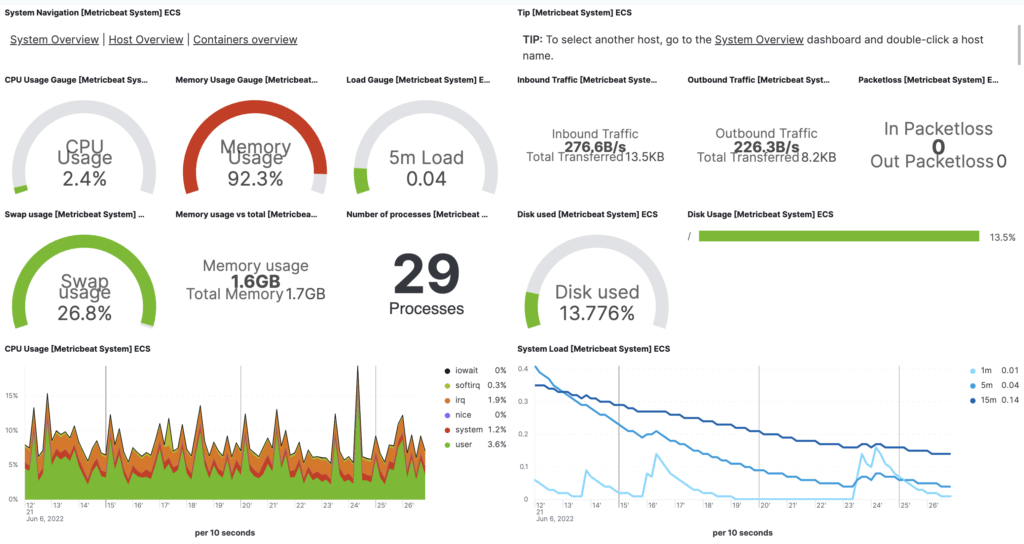
Loaded dashboards導入成功後可以在Kibana的Dashboard畫面中看到5、60種儀表板。
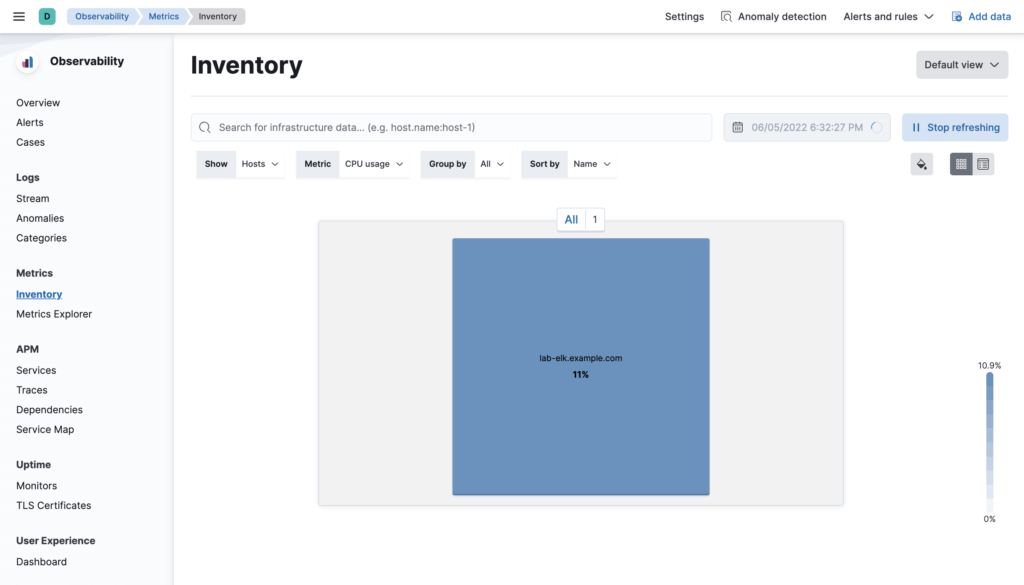
第6步:啟動Metricbeat。
$ systemctl start metricbeat第7步:在Kibana的Observability -> Metrics頁面就可以看到Metricbeat安裝並監控的主機。
監控模組
Metricbeat支援監控各種目標,設定也相當簡單。
第1步:移至”/etc/metricbeat/modules.d”,可以看到目錄裡有非常豐富的設定檔。
$ cd /etc/metricbeat/modules.d
$ ls
activemq.yml.disabled      docker.yml.disabled                  kibana-xpack.yml.disabled    prometheus.yml.disabled
aerospike.yml.disabled     dropwizard.yml.disabled              kibana.yml.disabled          rabbitmq.yml.disabled
airflow.yml.disabled       elasticsearch-xpack.yml.disabled     kubernetes.yml.disabled      redis.yml.disabled
apache.yml.disabled        elasticsearch.yml.disabled           kvm.yml.disabled             redisenterprise.yml.disabled
aws.yml.disabled           enterprisesearch-xpack.yml.disabled  linux.yml.disabled           sql.yml.disabled
awsfargate.yml.disabled    enterprisesearch.yml.disabled        logstash-xpack.yml.disabled  stan.yml.disabled
azure.yml.disabled         envoyproxy.yml.disabled              logstash.yml.disabled        statsd.yml.disabled
beat-xpack.yml.disabled    etcd.yml.disabled                    memcached.yml.disabled       syncgateway.yml.disabled
beat.yml.disabled          gcp.yml.disabled                     mongodb.yml.disabled         system.yml
ceph-mgr.yml.disabled      golang.yml.disabled                  mssql.yml.disabled           tomcat.yml.disabled
ceph.yml.disabled          graphite.yml.disabled                munin.yml.disabled           traefik.yml.disabled
cloudfoundry.yml.disabled  haproxy.yml.disabled                 mysql.yml.disabled           uwsgi.yml.disabled
cockroachdb.yml.disabled   http.yml.disabled                    nats.yml.disabled            vsphere.yml.disabled
consul.yml.disabled        ibmmq.yml.disabled                   nginx.yml.disabled           windows.yml.disabled
containerd.yml.disabled    iis.yml.disabled                     openmetrics.yml.disabled     zookeeper.yml.disabled
coredns.yml.disabled       istio.yml.disabled                   oracle.yml.disabled
couchbase.yml.disabled     jolokia.yml.disabled                 php_fpm.yml.disabled
couchdb.yml.disabled kafka.yml.disabled postgresql.yml.disabled第2步:選擇要監控的目標,將副檔名的”.disabled”拿掉,並編輯檔案內容,即設定完成。
第3步:若要觀看相關的效能指標,可以到Kibana的Dashboard選擇監控的目標。
~ END ~