
Elastic Stack 8 EP 6:Filebeat – 日誌收集
透過Filebeat收集資料
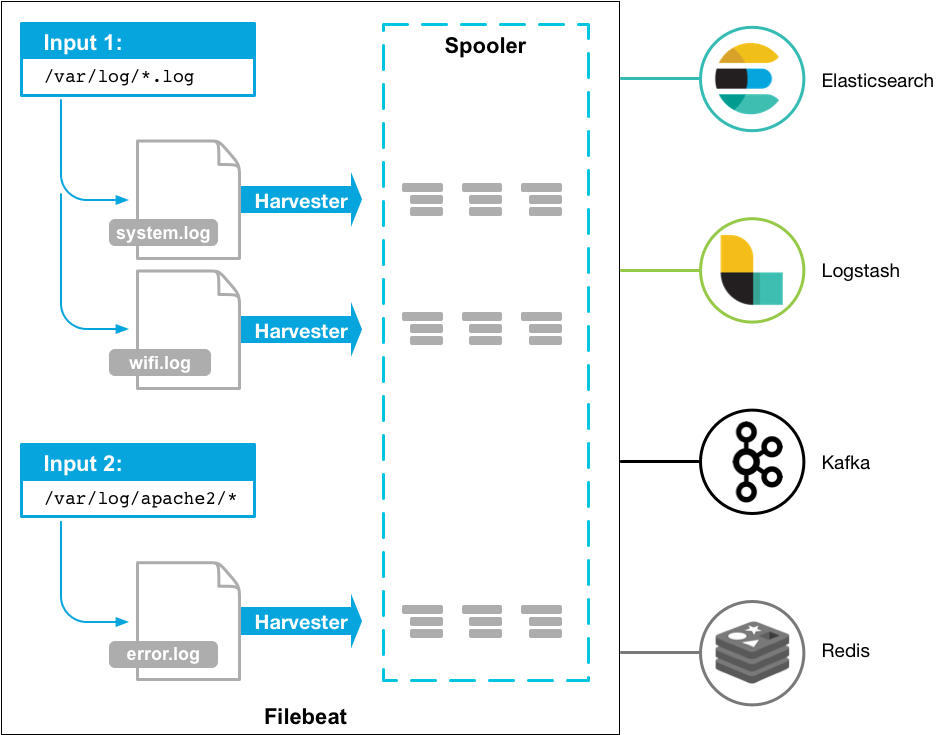
在IT環境中,不論硬體、軟體,每分每秒都會產生出大量的日誌、審計記錄、告警…等資料,這些資料若是以檔案的方式存在,就是Filebeat的防守範圍,透過檔案內容的解析與處理轉送到Elasticsearch留存。
設定Metricbeat操作Elasticsearch的帳號密碼
第1步:在Kibana畫面中,左側目錄:Stack Management -> Roles,點選畫面右邊的”Create role”,依照以下畫面新增一個名為”metricbeat_writer“的角色,權限:
- Cluster privileges:manage_index_templates、monitor
- Index privileges:
- Indeces:filebeat-*
- Privileges:write、create、create_index

第2步:在Kibana畫面中,左側目錄:Stack Management -> Users,點選畫面右邊的”Create user”,新增一個名為”filebeat_writer“的使用者,相關設定如下圖:

安裝並設定Filebeat
第1步:下載Filebeat (官方網站)。
$ cd /tmp/
$ wget https://artifacts.elastic.co/downloads/beats/filebeat/filebeat-8.2.0-x86_64.rpm第2步:安裝Filebeat。
$ yum install filebeat-8.2.0-x86_64.rpm -y第3步:調整設定檔 (/etc/filebeat/filebeat.yml)
$ vi /etc/filebeat/filebeat.yml

###################### Filebeat Configuration Example #########################

# This file is an example configuration file highlighting only the most common
# options. The filebeat.reference.yml file from the same directory contains all the
# supported options with more comments. You can use it as a reference.
#
# You can find the full configuration reference here:
# https://www.elastic.co/guide/en/beats/filebeat/index.html

# For more available modules and options, please see the filebeat.reference.yml sample
# configuration file.

# ============================== Filebeat inputs ===============================

filebeat.inputs:

# Each - is an input. Most options can be set at the input level, so
# you can use different inputs for various configurations.
# Below are the input specific configurations.

# filestream is an input for collecting log mesages from files.
- type: filestream

  # Unique ID among all inputs, an ID is required.
  id: my-filestream-id

  # Change to true to enable this input configuration.
  enabled: false

  # Paths that should be crawled and fetched. Glob based paths.
  paths:
    - /var/log/*.log
    #- c:\programdata\elasticsearch\logs\*

  # Exclude lines. A list of regular expressions to match. It drops the lines that are
  # matching any regular expression from the list.
  #exclude_lines: ['^DBG']

  # Include lines. A list of regular expressions to match. It exports the lines that are
  # matching any regular expression from the list.
  #include_lines: ['^ERR', '^WARN']

  # Exclude files. A list of regular expressions to match. Filebeat drops the files that
  # are matching any regular expression from the list. By default, no files are dropped.
  #prospector.scanner.exclude_files: ['.gz$']

  # Optional additional fields. These fields can be freely picked
  # to add additional information to the crawled log files for filtering
  #fields:
  #  level: debug
  #  review: 1

# ============================== Filebeat modules ==============================

filebeat.config.modules:
  # Glob pattern for configuration loading
  path: ${path.config}/modules.d/*.yml

  # Set to true to enable config reloading
  reload.enabled: false

  # Period on which files under path should be checked for changes
  #reload.period: 10s

# ======================= Elasticsearch template setting =======================

setup.template.settings:
  index.number_of_shards: 1
  #index.codec: best_compression
  #_source.enabled: false


# ================================== General ===================================

# The name of the shipper that publishes the network data. It can be used to group
# all the transactions sent by a single shipper in the web interface.
#name:

# The tags of the shipper are included in their own field with each
# transaction published.
#tags: ["service-X", "web-tier"]

# Optional fields that you can specify to add additional information to the
# output.
#fields:
#  env: staging

# ================================= Dashboards =================================
# These settings control loading the sample dashboards to the Kibana index. Loading
# the dashboards is disabled by default and can be enabled either by setting the
# options here or by using the `setup` command.
setup.dashboards.enabled: true

# The URL from where to download the dashboards archive. By default this URL
# has a value which is computed based on the Beat name and version. For released
# versions, this URL points to the dashboard archive on the artifacts.elastic.co
# website.
#setup.dashboards.url:

# =================================== Kibana ===================================

# Starting with Beats version 6.0.0, the dashboards are loaded via the Kibana API.
# This requires a Kibana endpoint configuration.
setup.kibana:

  # Kibana Host
  # Scheme and port can be left out and will be set to the default (http and 5601)
  # In case you specify and additional path, the scheme is required: http://localhost:5601/path
  # IPv6 addresses should always be defined as: https://[2001:db8::1]:5601
  host: "lab-elk.example.com:5601"

  # Kibana Space ID
  # ID of the Kibana Space into which the dashboards should be loaded. By default,
  # the Default Space will be used.
  #space.id:

# =============================== Elastic Cloud ================================

# These settings simplify using Filebeat with the Elastic Cloud (https://cloud.elastic.co/).

# The cloud.id setting overwrites the `output.elasticsearch.hosts` and
# `setup.kibana.host` options.
# You can find the `cloud.id` in the Elastic Cloud web UI.
#cloud.id:

# The cloud.auth setting overwrites the `output.elasticsearch.username` and
# `output.elasticsearch.password` settings. The format is `<user>:<pass>`.
#cloud.auth:

# ================================== Outputs ===================================

# Configure what output to use when sending the data collected by the beat.

# ---------------------------- Elasticsearch Output ----------------------------
output.elasticsearch:
  # Array of hosts to connect to.
  hosts: ["lab-elk-1.exmaple.com:9200", "lab-elk-2.exmaple.com:9200", "lab-elk-3.exmaple.com:9200"]

  # Protocol - either `http` (default) or `https`.
  protocol: "https"

  ssl.certificate_authorities: ["/etc/filebeat/http_ca.crt"]

  # Authentication credentials - either API key or username/password.
  #api_key: "id:api_key"
  username: "${es_user}"
  password: "${es_pwd}"

# ------------------------------ Logstash Output -------------------------------
#output.logstash:
  # The Logstash hosts
  #hosts: ["localhost:5044"]

  # Optional SSL. By default is off.
  # List of root certificates for HTTPS server verifications
  #ssl.certificate_authorities: ["/etc/pki/root/ca.pem"]

  # Certificate for SSL client authentication
  #ssl.certificate: "/etc/pki/client/cert.pem"

  # Client Certificate Key
  #ssl.key: "/etc/pki/client/cert.key"

# ================================= Processors =================================
processors:
  - add_host_metadata:
      when.not.contains.tags: forwarded
  - add_cloud_metadata: ~
  - add_docker_metadata: ~
  - add_kubernetes_metadata: ~

# ================================== Logging ===================================

# Sets log level. The default log level is info.
# Available log levels are: error, warning, info, debug
#logging.level: debug

# At debug level, you can selectively enable logging only for some components.
# To enable all selectors use ["*"]. Examples of other selectors are "beat",
# "publisher", "service".
#logging.selectors: ["*"]

# ============================= X-Pack Monitoring ==============================
# Filebeat can export internal metrics to a central Elasticsearch monitoring
# cluster.  This requires xpack monitoring to be enabled in Elasticsearch.  The
# reporting is disabled by default.

# Set to true to enable the monitoring reporter.
#monitoring.enabled: false

# Sets the UUID of the Elasticsearch cluster under which monitoring data for this
# Filebeat instance will appear in the Stack Monitoring UI. If output.elasticsearch
# is enabled, the UUID is derived from the Elasticsearch cluster referenced by output.elasticsearch.
#monitoring.cluster_uuid:

# Uncomment to send the metrics to Elasticsearch. Most settings from the
# Elasticsearch output are accepted here as well.
# Note that the settings should point to your Elasticsearch *monitoring* cluster.
# Any setting that is not set is automatically inherited from the Elasticsearch
# output configuration, so if you have the Elasticsearch output configured such
# that it is pointing to your Elasticsearch monitoring cluster, you can simply
# uncomment the following line.
#monitoring.elasticsearch:

# ============================== Instrumentation ===============================

# Instrumentation support for the filebeat.
#instrumentation:
    # Set to true to enable instrumentation of filebeat.
    #enabled: false

    # Environment in which filebeat is running on (eg: staging, production, etc.)
    #environment: ""

    # APM Server hosts to report instrumentation results to.
    #hosts:
    #  - http://localhost:8200

    # API Key for the APM Server(s).
    # If api_key is set then secret_token will be ignored.
    #api_key:

    # Secret token for the APM Server(s).
    #secret_token:


# ================================= Migration ==================================

# This allows to enable 6.7 migration aliases
#migration.6_to_7.enabled: true第4步:測試一下設定檔是否正確無誤。
$ /usr/share/filebeat/bin/filebeat test config --path.config /etc/filebeat/

Config OK第5步:建立並設定Keystore。
$ /usr/share/filebeat/bin/filebeat keystore create --path.config /etc/filebeat/
Created filebeat keystore

$ /usr/share/filebeat/bin/filebeat keystore add es_user --path.config /etc/filebeat/
Enter value for es_user: filebeat_writer
Successfully updated the keystore

$ /usr/share/filebeat/bin/filebeat keystore add es_pwd --path.config /etc/filebeat/
Enter value for es_pwd: password
Successfully updated the keystore第6步:導入Filebeat的Dashboard到Kibana。
$ /usr/share/filebeat/bin/filebeat setup --dashboards --path.config /etc/filebeat/第7步:啟動Filebeat。
$ systemctl start filebeat
$ systemctl enable filebeat
各種日誌來源收集模組
第1步:在”/etc/filebeat/modules.d”目錄下有各種的日誌來源收集範本。
$ ls /etc/filebeat/modules.d

activemq.yml.disabled    checkpoint.yml.disabled     fortinet.yml.disabled          iptables.yml.disabled   mysql.yml.disabled            osquery.yml.disabled     snort.yml.disabled        traefik.yml.disabled
apache.yml.disabled      cisco.yml.disabled          gcp.yml.disabled               juniper.yml.disabled    mysqlenterprise.yml.disabled  panw.yml.disabled        snyk.yml.disabled         zeek.yml.disabled
auditd.yml.disabled      coredns.yml.disabled        google_workspace.yml.disabled  kafka.yml.disabled      nats.yml.disabled             pensando.yml.disabled    sonicwall.yml.disabled    zookeeper.yml.disabled
aws.yml.disabled         crowdstrike.yml.disabled    haproxy.yml.disabled           kibana.yml.disabled     netflow.yml.disabled          postgresql.yml.disabled  sophos.yml.disabled       zoom.yml.disabled
awsfargate.yml.disabled  cyberarkpas.yml.disabled    ibmmq.yml.disabled             logstash.yml.disabled   netscout.yml.disabled         proofpoint.yml.disabled  squid.yml.disabled        zscaler.yml.disabled
azure.yml.disabled       cylance.yml.disabled        icinga.yml.disabled            microsoft.yml.disabled  nginx.yml.disabled            rabbitmq.yml.disabled    suricata.yml.disabled
barracuda.yml.disabled   elasticsearch.yml.disabled  iis.yml.disabled               misp.yml.disabled       o365.yml.disabled             radware.yml.disabled     system.yml.disabled
bluecoat.yml.disabled    envoyproxy.yml.disabled     imperva.yml.disabled           mongodb.yml.disabled    okta.yml.disabled             redis.yml.disabled       threatintel.yml.disabled
cef.yml.disabled f5.yml.disabled infoblox.yml.disabled mssql.yml.disabled oracle.yml.disabled santa.yml.disabled tomcat.yml.disabled第2步:任選一個檔案,去除檔案名稱後面的”disabled”,並調整檔案內的設定參數即可完成轉送Elasticsearch。
~ END ~